Monitoring the training process in team sports
From description to prescription: Part 2
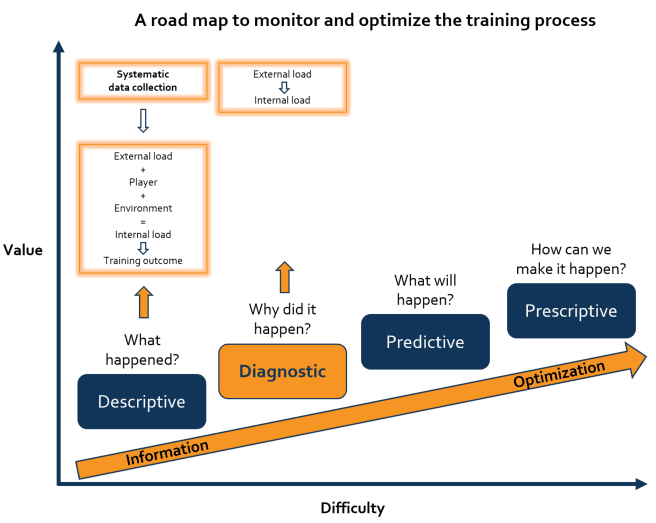
In our previous blog post, we discussed the first stage of the monitoring process, description. Here, we focused on systematic data collection using different tools to describe the training process according to the framework of Impellizzeri and colleagues (2019).
Although the proper execution of the descriptive stage is essential and already challenging, an often-made mistake in practice is ‘measuring just for the sake of measuring’. In other words, if your data is not analysed to obtain insights and, ultimately, to apply it in a prescriptive way, there is little benefit in collecting it. The current blog post and also upcoming topics will discuss the second stage of the monitoring process: diagnostic analytics.
This second stage allows to obtain insights in the various relationships within the training process. These insights are essential to use your collected data in a prescriptive way. In practice, the training load is often prescribed using external load indicators such as the number of repetitions, training duration, the distance ran and the number of sprints.
The external load performed during training or matches elicits certain body responses. These response can be described using internal load indicators measured by objective (e.g. heart rate, blood lactate) and subjective tools (e.g. rating of perceived exertion). The overall body response, or internal load, is the ultimate stimulus for the training outcome. This can be an improved physical fitness, an injury or illness.
In terms of the question ‘Why did it happen?’, various relationships within the training process can be analysed:
- The external-internal load relationship
- The load-performance relationship
- The load-injury relationship.
In this blog post, we start with the first relationship: the external-internal load relationship.

Insights in the relationship between the external load and the corresponding internal load are important. They help to understand why a match is perceived as easy, moderate or hard by players or why a training session elicits a low or high heart rate. Additionally, it can allow to evaluate if a player is becoming more efficient when he/she can perform more external load relative to the (previous) internal load.
Training efficiency is an interesting topic that was earlier described by Jace Delaney (Boston Celtics) and colleagues and Matthieu Lacome (PSG) and colleagues. Following their methods, it may be possible for practitioners to evaluate players’ physical fitness without the necessity for regular testing.
In a recent systematic review, Shaun McLaren and colleagues evaluated and summarised evidence about external-internal load relationships. One of their main findings was that higher external loads elicit higher internal loads, something that is rather obvious. In more detail, the magnitude of this relationship depends on:
- The specific indicator used (e.g. total distance versus high-speed running, heart rate or rating versus perceived exertion)
- The type of training performed (e.g. skill-based, cardiovascular-based or neuromuscular-based training).
Hence, in conclusion, it seems useful to assess those indicators (and their relationships) that are most related to the specific training type and the training goal. Also, external-internal load relationships are influenced by both player (e.g. training status) and environmental (e.g. temperature) characteristics. Therefore, it is advised to analyse the external-internal load relationships on a within-player level considering individual characteristics and to take important environmental factors into account.
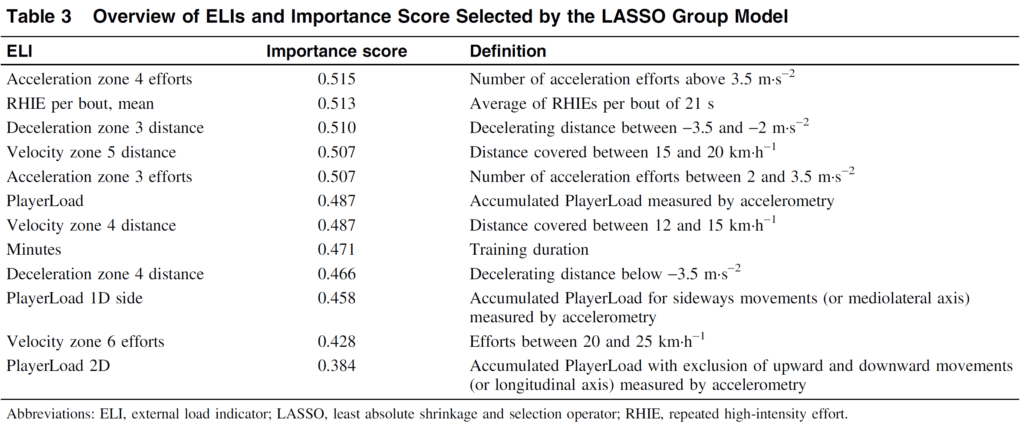
Since 2014 Topsportslab supported, and is still supporting, PhD research projects in cooperation with the University of Leuven. In these academic projects, the relationship between external and internal load is one of the main research topics. In a successful PhD project by Arne Jaspers, Werner Helsen, Filip Staes and Michel Brink, the relationship between GPS-based external load indicators and an internal load indicator (i.e. RPE) was examined in professional football.
In short, this article confirmed the idea that various external load indicators contribute to the internal load response (see table, a higher importance score indicates a higher contribution to the internal load response). Thereby making it challenging to describe the overall training load and to analyse the external-internal load relationship using one single external and one single internal load indicator.

In this study, we applied machine learning techniques which was rather novel to examine external-internal load relationships. Various techniques can be applied to identify key load indicators and obtain insights. Principal component analysis (PCA) is another interesting technique to apply when analysing load relationships. Weaving and colleagues have used this technique in several studies examining relationships between load indicators (link1, link2, link3).
In brief, this technique allows to handle the complexity of defining the ‘load’ of training sessions. This is often the case when using GPS, heart rate and RPE to collect a multitude of load indicators which are often highly correlated. More specific, PCA allows to identify the key load indicators that provide unique information about the training load of a session. Therefore, PCA can be used to overcome a data overload by reducing your large number of load indicators into a dashboard that provides the information you need.
Advanced analysis techniques such as machine learning and PCA demand sufficient knowledge, data, time and effort (slow approach). However, as a practitioner, time is often valuable and fast insights to support decisions are key (fast approach). In this case, simpler techniques can be applied to obtain instant insights on a daily basis.
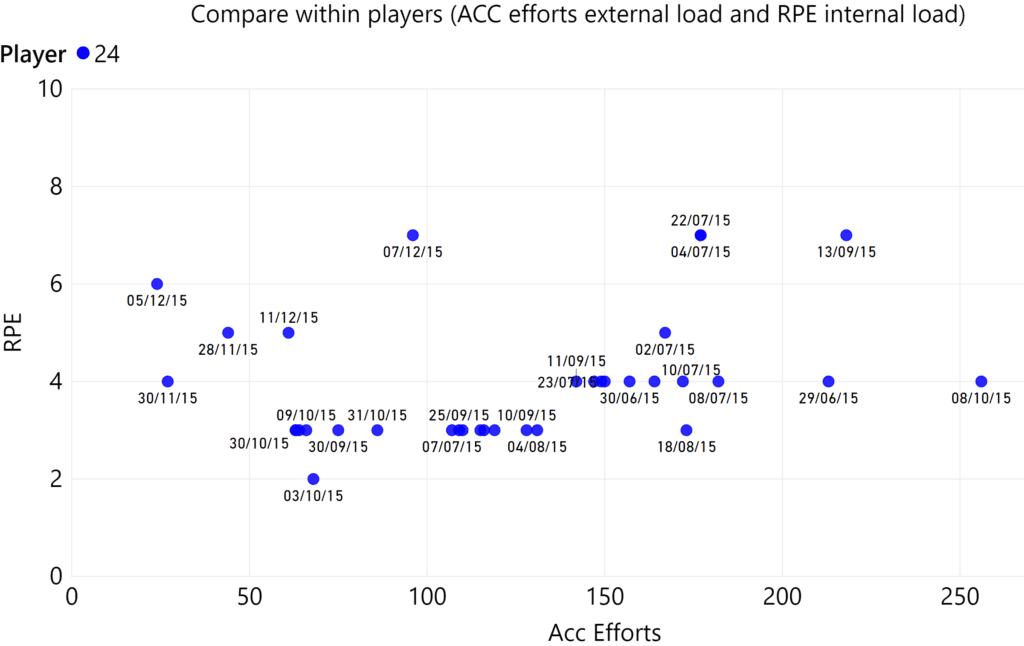
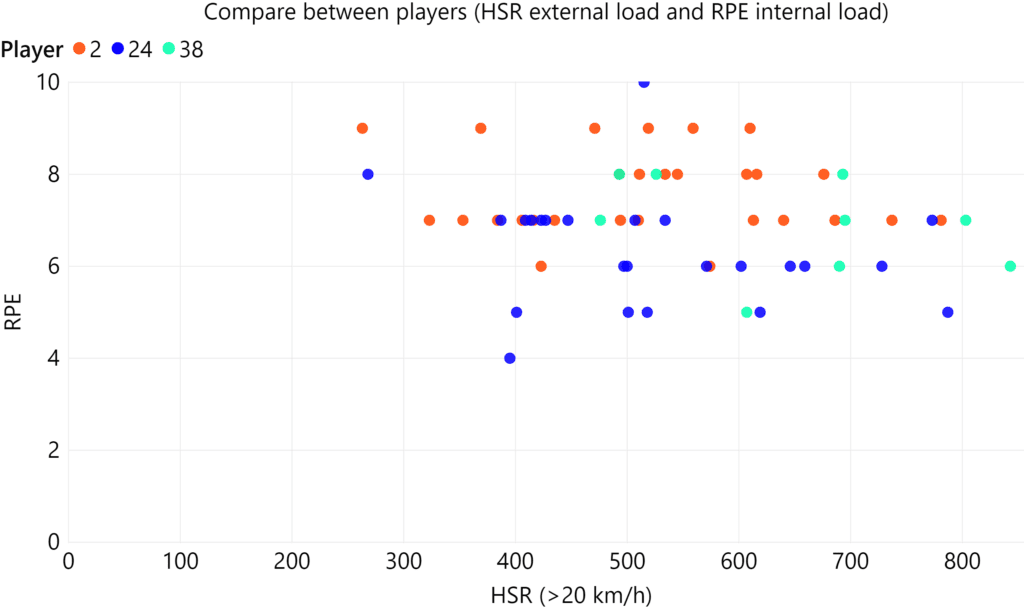
For example, scatter plots could be designed using software as Tableau or Power BI (see graphs).
In graph 1, the RPE is indicated in relation to the distance ran at high speed (>20 km/h) for matches.
In graph 2, the RPE is showed in relation to the acceleration efforts for training sessions.
Dates can be added to observe possible trends over time, for example more accelerations efforts for a lower RPE. Scatter plots are easy to apply in our own Topsportslab platform. We will discuss their possibilities for monitoring the training process in a future blog post. Next to the fast insights, it can be useful to invest more time in advanced analyses techniques on particular moments throughout a season, possibly in collaboration with academic researchers.


In 2018, the University of Leuven and Topsportslab started a new PhD collaboration (Kobe Houtmeyers, Werner Helsen, Jos Vanrenterghem, Michel Brink and Arne Jaspers) in which the external-internal load relationship will be further examined.
To be more specific, in this project the validity of differential RPE (i.e. cardiovascular and musculoskeletal RPE) will be investigated in relation to different external load indicators. Possibly, differential RPE may provide a more sensitive measure of the internal load response to a given external load and could offer a lot of practical applications. Something we will discuss in the near future.
To summarise, in this blog we outlined a first relationship that can be analysed in the diagnostic stage of the monitoring process, the external-internal load relationship. This relationship is important to understand the effect of the prescribed external load and can be analysed using different techniques. Obviously, higher external loads elicit higher internal loads but the magnitude of this relationships depends on the specific indicator and the training type. Therefore, it is advised to adopt a multivariate approach when prescribing and evaluating the overall training load.
In our next blog, we will focus on a second relationship in the diagnostic stage, the load-performance relationship.
Interested in load monitoring?
Want to see how our platform can help you easily monitor training process in team sports?
Care to keep updated?
Subscribe to our newsletter.
You'll get updates about our recent blog posts and platform updates.